Apple stock to suffer first ‘death cross’ chart pattern since the pandemic
Apple Inc.’s stock has fallen far enough and for long enough to produce a certain ominous-sounding bearish chart pattern should didn’t appear during the short COVID-19-induced bear-market selloff of early 2020.
The technology behemoth’s stock
AAPL,
rallied 1.2% in afternoon trading Thursday. It has bounced 9.6% since closing at a 10-month low of $137.35 on May 19, which was 24.5% below the Jan. 3, 2022 record close of $182.01.
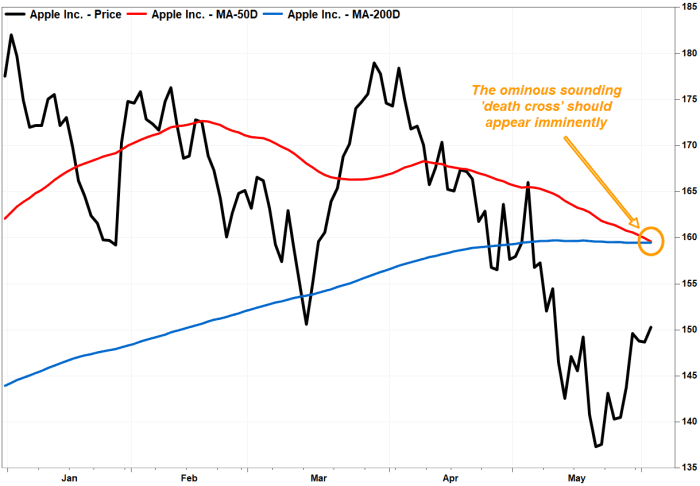
The stock has fallen far enough and for long enough to put its 50-day moving average (DMA), which many chart watchers view as a short-term trend tracker, on track to cross below its 200-day moving average (DMA), which is viewed as a dividing line between longer-term uptrends and downtrends, as early as Friday.
That crossover, which is referred to as a “death cross,” is seen by some technicians as marking the spot that a shorter-term selloff graduates to a longer-term downtrend.
Apple’s 50-DMA fell to $159.573 on Thursday from $159.939 on Wednesday, according to FactSet data, and has declined by an average of 30 cents over the past 20 sessions, while the 200-DMA inched up to $159.489 from $159.487. At that pace of DMA changes, the death cross should appear on Friday.
The stock has been weighed down by concerns over how supply chain challenges and COVID-19-related lockdowns in China could hurt Apple’s earnings, and as rising interest rates have led to reduced valuations of high-growth stocks.
FactSet, MarketWatch
History suggests death crosses aren’t necessarily good market timing tools, as they are well telegraphed, but they can be useful in putting a stock’s recent performance in perspective.
Also read: Why the Tesla ‘death cross’ shouldn’t scare off investors.
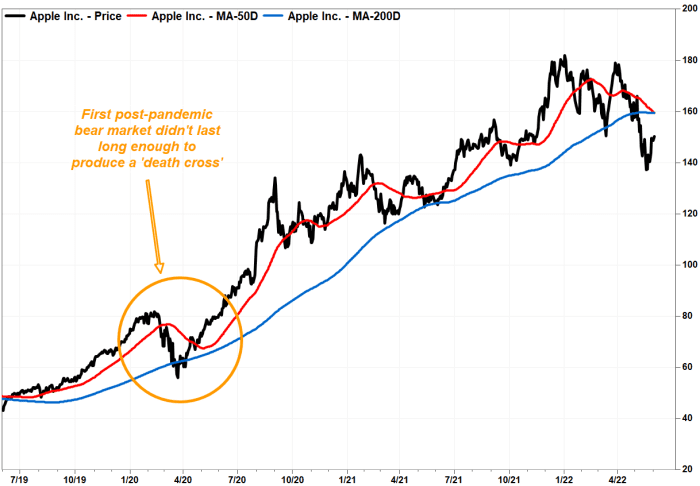
In early 2020, the stock sank as much as 31.4% from the then-record close of $81.80 on Feb. 12 to the five-month low of $56.09 on March 23, as the COVID-19 pandemic fueled fear that lockdowns would cripple the economy.
The stock may have fallen far enough, but not quiet long enough, as the closest the 50-DMA got to the 200-DMA was $2.473, or 3.7% above it, on May 18, 2020.
FactSet, MarketWatch
During the early-2021 correction, the stock fell 18.7% to the March 8 closing low of $116.36 from the then-record close of $143.16 on Jan. 26. That wasn’t significant enough to produce a death cross either, as the closest the moving averages got was $3.758, or 3.0%, on May 27.
Apple’s last death cross appeared on Dec. 20, 2018, after the stock had tumbled 32.4% from a then-record $58.02 on Oct. 3, 2018. The stock fell another 9.3% before bottoming on Jan. 3, 2019 at a 21-month low of $35.55, which was 38.7% below its record.
The one before that appeared on Aug. 26, 2015, with the stock down 17.5% from its previous record close of $33.25 on Feb. 23, 2015. The stock didn’t bottom until it fell another 17.7% to a near two-year low of $22.58 on May 12, 2016.
Among Apple’s high-tech and mega-capitalization peers, Microsoft Corp.’s stock
MSFT,
produced a death cross on March 15 and has declined 5.2% since then, Alphabet Inc. shares
GOOGL,
GOOG,
have fallen 11.9% since their death cross appeared on March 9 and Amazon.com Inc.’s stock
AMZN,
has slumped another 10.9% since producing a death cross on Jan. 25.
Meanwhile, the Dow Jones Industrial Average
DJIA,
produced a death cross on March 8 and has edged up 1.3% since, while that pattern appeared in the Nasdaq Composite Index’s
COMP,
chart on Feb. 18 and the tech-friendly index has lost 9.5% since.